
Free Data Sources for International Market Research: Where to Find Reliable Expansion Data
Free Data Sources for International Market Research: Where to Find Reliable Expansion Data
Free data for international market expansion is published by international organizations and governments. ITC Trade Map and UN Comtrade cover trade flows, ITC Market Access Map and World Bank WITS cover tariffs, World Bank Enterprise Surveys and US Country Commercial Guides cover the business environment, and DataReportal and Google Trends cover digital behavior. Most are free, some require registration, and none replace primary research with real customers.
International market research usually starts with secondary data, and the most reliable secondary data is free. International organizations and national trade agencies publish it for exporters, researchers and policymakers.

The difficulty is knowing which source answers which question. Trade statistics show where a product already sells, tariff databases show what it costs to get there, and business environment surveys show how hard it is to operate once a company arrives. The sections below group each source by the question it answers.
Which free data sources answer which market research question?
Each free source answers one part of the market selection question: demand, trade flows, tariffs, business environment, digital behavior or consumer interest.
| Source | What it answers | Cost | Best for |
|---|---|---|---|
| ITC Trade Map | Trade flows, import demand | Free with registration; paid plans exist | Ranking import markets for a product |
| UN Comtrade | Trade flows | Free; registration for bulk and API use | Detailed historical trade data |
| ITC Export Potential Map | Untapped export demand | Free | Spotting product and market pairs |
| WTO Stats | Trade flows, tariffs | Free | Headline trade and tariff indicators |
| ITC Market Access Map | Tariffs, non-tariff measures | Free with registration; paid plans exist | Comparing duties across markets |
| World Bank WITS | Tariffs, trade flows | Free | Tariff and trade analysis in one place |
| World Bank Open Data | Economy, demographics | Free | Market size and income indicators |
| IMF World Economic Outlook database | Economic outlook | Free | GDP and inflation projections |
| World Bank Enterprise Surveys | Business environment | Free; registration for firm-level data | Operating conditions by country |
| OECD FDI statistics | Investment flows | Free | Gauging foreign investor activity |
| US Country Commercial Guides | Business environment, regulation | Free | Country-level entry overviews |
| Enterprise Singapore, JETRO | Market intelligence, support schemes | Free | Singapore and Japan corridors |
| ASEANstats, SingStat, US Census | Demographics, regional trade | Free | Official national and regional figures |
| DataReportal | Digital behavior | Free | Internet and social media adoption |
| Google Trends | Consumer interest | Free | Comparing search interest by country |
Which free sources show demand and trade flows?
ITC Trade Map, UN Comtrade, the ITC Export Potential Map and WTO Stats are the main free sources for trade flows. They show which countries import a product, how much they buy, and which suppliers they buy from.
1. ITC Trade Map
ITC Trade Map is the International Trade Centre’s database of import and export values, volumes, growth rates and market shares, with monthly, quarterly and yearly data. ITC Trade Map is free with registration, though access terms vary by the user’s country and the ITC sells paid plans for heavier use.
It’s best for ranking import markets for a specific product at the HS code level. A practical tip is to sort importing countries by five-year growth rather than total value, because the largest markets are often the most crowded.
2. UN Comtrade
UN Comtrade is the United Nations database of official international trade statistics reported by national customs authorities. UN Comtrade is free to search, with registration required for bulk downloads and API access.
It’s best for long historical series and for checking figures from other tools. A practical tip is to compare a country’s reported imports with its partners’ reported exports, since the two rarely match.
3. ITC Export Potential Map
The ITC Export Potential Map estimates where an exporting country has untapped potential to sell specific products, based on supply, demand and market access conditions. It’s free and still maintained by the International Trade Centre.
It’s best for generating a first list of product and market pairs before deeper analysis. A practical tip is to treat its estimates as a starting hypothesis and confirm them against Trade Map growth figures.
4. WTO Stats
WTO Stats is the World Trade Organization’s statistics portal for merchandise trade, services trade and tariff indicators. It’s free and best for headline comparisons across economies.
Which free sources show tariffs and market access requirements?
ITC Market Access Map and World Bank WITS are the main free sources for tariffs and trade barriers. They show the duty a product faces in each market and the agreements that lower it.

5. ITC Market Access Map
ITC Market Access Map is a free portal for customs tariffs, tariff rate quotas, trade remedies and non-tariff measures applied to a specific product in any market. Registration is free, and the ITC also offers paid plans with added features.
It’s best for comparing the duty a product faces across several shortlisted markets. A practical tip is to check the tariffs that competitors from other origin countries pay, because a trade agreement can give a rival a price advantage.
6. World Bank WITS
World Integrated Trade Solution (WITS) is the World Bank’s free platform combining trade statistics, tariff data and non-tariff measures, drawing on sources including UN Comtrade and UNCTAD TRAINS. It’s best for analysts who want trade and tariff data in one tool.
Which free sources describe the economy and business environment?
World Bank Open Data, the IMF World Economic Outlook database, World Bank Enterprise Surveys and OECD FDI statistics describe the economic and operating conditions in a market. They answer whether a market can afford a product and how difficult it is to do business there.
7. World Bank Open Data
World Bank Open Data is a free database of development indicators such as population, GDP per capita, urbanization and internet use by country. A practical tip is to use GDP per capita at purchasing power parity when comparing affordability.
8. IMF World Economic Outlook database
The IMF World Economic Outlook database holds free historical data and projections for GDP growth, inflation, unemployment and government finances, published each April and October. It’s best for checking whether a market’s growth outlook supports a multi-year entry plan.
9. World Bank Enterprise Surveys
World Bank Enterprise Surveys are firm-level surveys that show what operating a business is like in a given country. According to the World Bank Enterprise Surveys (2026), the surveys interview top managers and owners of businesses in over 160 economies on topics including access to finance, corruption, infrastructure and performance.
Indicators are free to browse, and registration and downloads of firm-level data are also free. A practical tip is to check the survey year for each economy, since some countries are surveyed far less often than others.
10. OECD FDI statistics
OECD FDI statistics track foreign direct investment flows and positions by country and partner economy. They’re free and best for gauging whether foreign companies are already investing in a market.
Which official guides explain how to do business in a specific country?
Government trade agencies publish free country guides that combine market data with regulatory and cultural context. The US International Trade Administration, Enterprise Singapore and JETRO suit the US, Singapore and Japan corridors.

11. US Country Commercial Guides
Country Commercial Guides are free reports from the US International Trade Administration on market conditions, regulations and business customs in individual countries. According to the US International Trade Administration (2026), the guides are prepared at US Embassies worldwide by Commerce Department, State Department and other US agency professionals.
They’re best for a structured first overview of a market. The guides are useful to non-US companies too, since most of the content describes the destination market.
12. Enterprise Singapore
Enterprise Singapore is the Singapore government agency that supports local companies expanding overseas, with free market information and access to support schemes. Its resources suit Singapore-registered companies, which can also apply for grant funding such as the EDGE Grant, which replaced the Market Readiness Assistance grant on 30 September 2026 and co-funds eligible overseas expansion activities.
13. JETRO
The Japan External Trade Organization (JETRO) publishes free English-language survey reports, market reports by industry, a trade and investment white paper and Japanese trade statistics. It’s best for companies entering Japan or partnering with Japanese firms.
14. ASEANstats and national statistics offices
ASEANstats, the ASEAN Secretariat’s statistics portal, publishes free regional data on trade, investment and population across its member states. National offices such as SingStat in Singapore and the US Census Bureau publish the underlying official figures.
Which free sources show digital behavior and consumer interest?
DataReportal and Google Trends are the main free sources for digital adoption and consumer interest by country.
15. DataReportal
DataReportal publishes the free Digital reports produced by Kepios with We Are Social and Meltwater, covering internet, social media, ecommerce and device use by country. According to DataReportal’s Digital 2026 Global Overview Report (2026), Kepios analysis found 6.04 billion internet users at the start of October 2025, a global penetration rate of 73.2 percent.
A practical tip is to use the individual country reports, since channel mix differs sharply between neighboring markets.
16. Google Trends
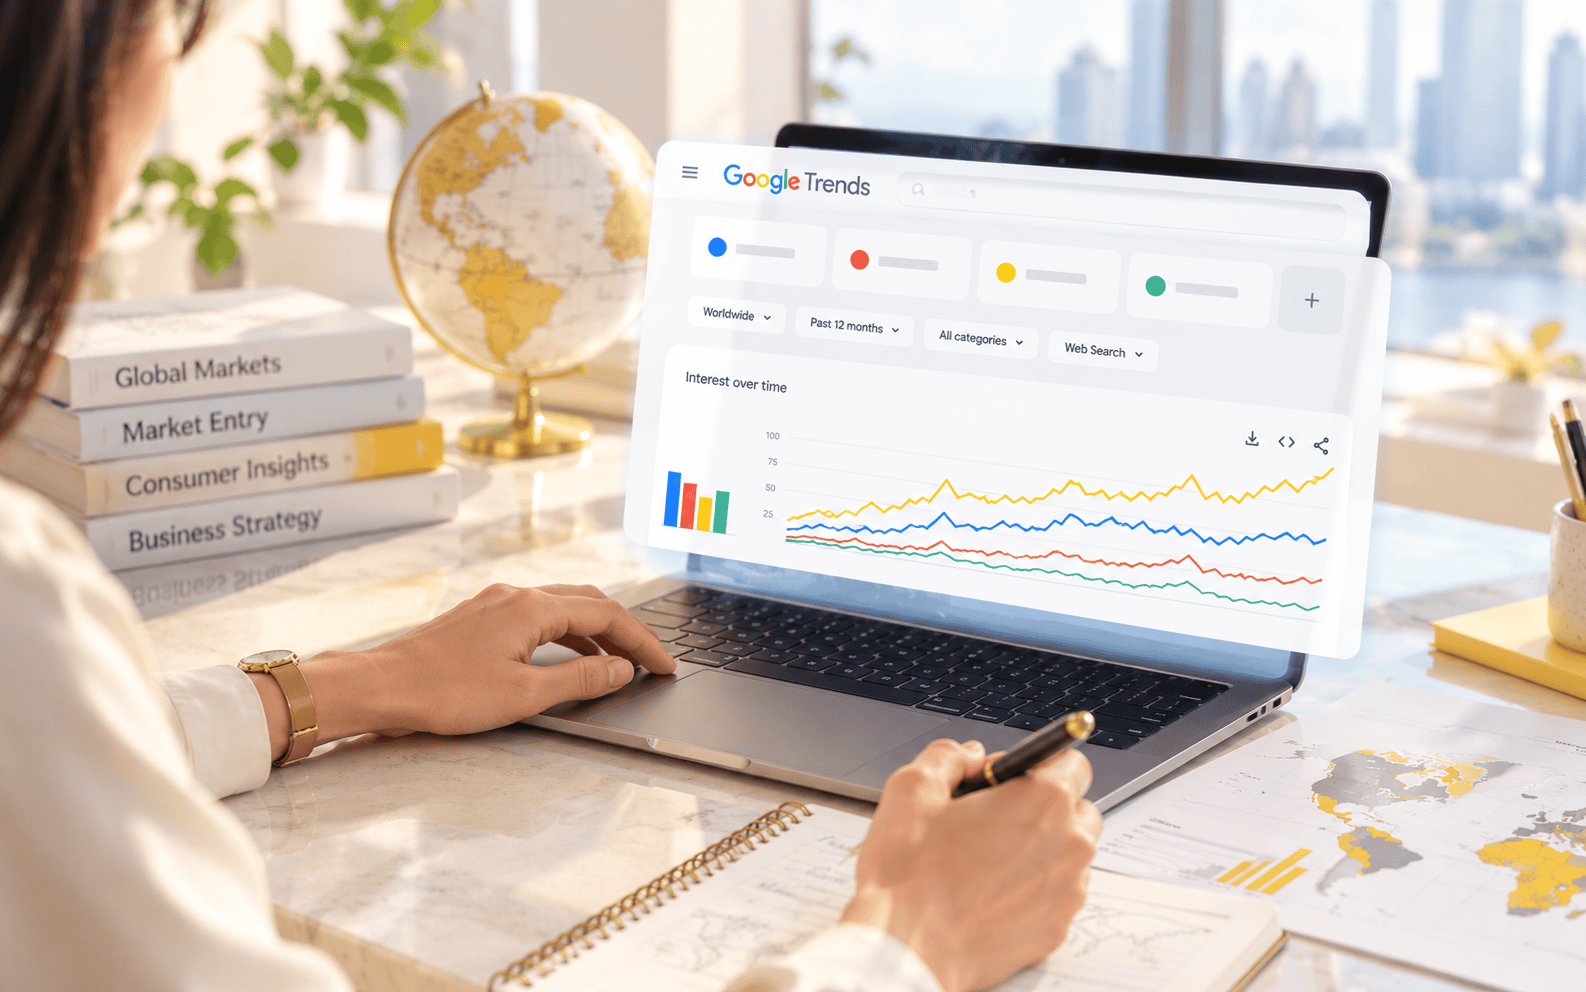
Google Trends shows the relative search interest in a topic by country, region and time period. According to Google’s Trends FAQ (2026), the tool uses a largely unfiltered sample of actual searches and normalizes each data point against total searches in that geography and time range.
It’s free and best for comparing category interest between markets and spotting seasonality. A practical tip is to compare topics rather than single keywords, because topics group searches across languages.
How do you combine free data sources into a market shortlist?
A market shortlist comes from filtering a long list of countries through demand, access, operating conditions and audience data in sequence. The workflow below uses only the free sources above.
- Build a long list from trade data. Use ITC Trade Map or UN Comtrade to list the top importing countries for the product’s HS code, and add any markets flagged by the Export Potential Map.
- Rank by growth and supplier mix. Keep markets with rising imports and a supplier mix that isn’t dominated by one or two origin countries.
- Check tariffs and barriers. Use Market Access Map or WITS to compare duties and non-tariff measures, including what competitors pay.
- Screen the economy and operating conditions. Use World Bank Open Data, the IMF outlook and Enterprise Surveys to remove markets with weak purchasing power or difficult operating conditions.
- Read the country guides. Use Country Commercial Guides, JETRO or Enterprise Singapore material for regulation, distribution and business customs.
- Test audience and interest. Use DataReportal and Google Trends to check digital reach and category interest in the final three to five markets.
- Decide where primary research is needed. Commission customer interviews, surveys or channel checks for the top one or two markets before committing budget.
What are the main types of international market research?
The two main types of international market research are secondary research, which analyzes data that already exists, and primary research, which collects new data directly from customers, distributors or partners in the target market. Most expansion projects use secondary research to choose markets and primary research to validate the final choice.
Secondary research includes every source in this guide. Primary research includes surveys, interviews, focus groups and test campaigns, and it’s the only way to learn how local buyers perceive a specific brand, price or message.
What are the limits of free market research data?
Free market research data shows the size and direction of a market, but it doesn’t show why customers buy, what they’d pay or how they see a specific brand. Official statistics also lag, with trade and survey data often a year or more old by the time they’re published.
HS product codes can also hide a niche product’s demand inside a broad category. Primary research becomes worth commissioning once a shortlist has two or three markets and the remaining questions concern pricing, positioning, channel partners or brand perception.

At Creative For More, we use these sources in our market entry research before recommending a market, then add customer and channel research in the markets that make the shortlist. Our go-to-market planning includes Southeast Asia market research across Singapore, Indonesia, Malaysia, Thailand, Vietnam and the Philippines, supported by Japanese account managers based in Japan and a network of more than 30 agency and business matching partners. For companies weighing the region, the Southeast Asia market entry guide explains how the research feeds into entry sequencing.
If you’re shortlisting markets and want the data turned into a clear entry recommendation, our team can carry the research from secondary sources through to on-the-ground validation. If your company is looking for a strategic marketing partner, the Creative For More team can help. Book a discovery call to explore how we can support your brand’s growth.
Read More

Geraldine Pang
Creative For More
Geraldine Pang is the founder of Creative For More, a cross-border digital marketing agency with offices in Singapore, Tokyo, and New York. She specializes in brand strategy, market entry, and cross-border marketing across Southeast Asia, Japan, and the United States.